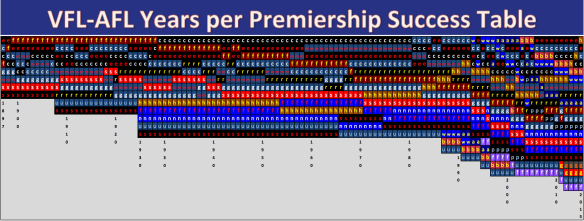
Beginning at 1897 (left) and working right, this completely overwhelming table shows every season played, when teams joined and which teams were and are the most successful when ‘years competed’ are divided by ‘premierships won.’ It’ll make more sense as you read on…I hope!
How do you measure success? Is it by sheer amount of games won? Because if so, that would make Collingwood the most successful team to have played in the VFL-AFL competition. Or is it simply by the number of premierships? Because then it’s Carlton and Essendon who are sitting pretty with 16 premierships apiece.
Well I don’t necessarily look at it that way, however I’m still seeing premiership glory as the measurement of success. A quick look at the history books shows you that Essendon did not compete in the 1916-1917 VFL seasons during World War 1. Now I’m splitting hairs, but as Carlton has had two more opportunities to win a premiership, does that not make Essendon’s 16 premierships ever so slightly more impressive?
Let’s give that theory some form. Let’s calculate how often a team wins a premiership by dividing the number of years competed by the number of flags won. As it currently stands, Essendon wins a flag every 7.31 years, Carlton every 7.44 years. Slightly, yet still, more successful.
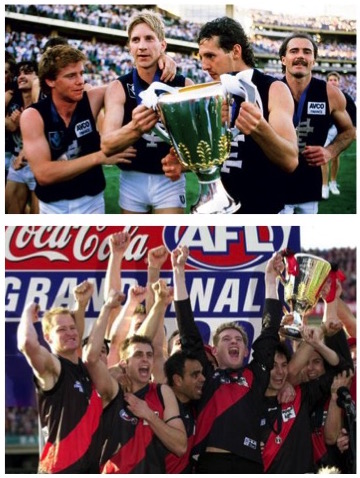
Well that is all good and well. However in 2015, using this system to measure success, there was a significant changing of the guard. We all know the Hawthorn story. The team that was let into the VFL in 1925 not on merit, rather due to geography. They then spent the best part of four decades as Mustard Pots, Mayblooms and easy beats. But with a name change to the predatory Hawks combined with the ruthless attitude change, the club has never looked back. The 1950s are the last decade that Hawthorn have spent without a premiership, a most remarkable feat.

But how successful are they? 13 flags places them in fourth position on the VFL-AFL premiership table, however what must be remembered is that they only joined the league in 1925, some 28 years after the league was formed. Where Essendon and Carlton have participated in 117 and 119 season respectively, the Hawks 13 flags come from just 91 years of competition.
At the end of 2014, with the winning of their 12th premiership, Hawthorn averaged a flag every 7.5 years, slightly behind Carlton (7.38 years) and Essendon (7.25 years.) But here is the momentous part. After winning the 2015 flag, Hawthorn finally sits atop all other comers as the league’s most successful club, averaging a flag every 7 years, (see table below) skipping ahead of Essendon who now average one every 7.31 years and Carlton who average one every 7.44 years. At the other end of the spectrum we have poor old St.Kilda who average a flag once every 116 years. In that light I’ll take Richmond’s ‘flag every 10.8 years,’ even though I’ve seen none of them.


Using the same table as before however highlighting only Hawthorn’s progress from 1925, you can see their rise to the top of the league
So while I did this research based on looking at Hawthorn’s success, there were a number of other interesting aspects to the tables. Firstly Fitzroy. Eight flags in one hundred seasons means that by the time were no longer a league team, the Roys averaged a flag every 12.5 years. However after 1922, they averaged a flag every 3.71, the leagues earliest power. We might look back and see that as a quaint old notion but at the time it was very real.
As Fitzroy have finished competing, along with University, their statistics will never change. They still sit mid table for VFL-AFL success, and I’m glad they’ve got something to show for all of their early dominance. \

Collingwood’s table also made for interesting reading. After taking over from Fitzroy in 1930 with their fourth successive flag, a record which is under threat from Hawthorn this year, the Carringbush sat atop the league until grand final day 1981, where Carlton not only defeated them but equalled them on the ‘success’ table, surpassing them the following year. Collingwood’s 52 consecutive years at the top is by far the longest reign in VFL-AFL football.


However it was nearly interrupted. Melbourne came oh so close to knocking Collingwood off the number 1 position with their 12th flag in 1964. While Collingwood had won 13 premierships at the point in time, it was the three season’s that Melbourne had missed during world war 1 which made their premiership average slightly healthier as you can see below. But that’s as close as they would get. By Collingwood winning the 1958 premiership they not only defended their recording breaking 4 successive premierships, but also maintained their unbroken 52 years atop the league in terms of premiership success.


Melbourne’s last flag in 1964, when they almost caught up with the Pies. That 1958 Collingwood win not only protected their 4-peat.
Another very interesting part was to see the impact that the teams entering the league from 1987 onwards had on the table, in particular those that enjoyed early successes. Now that clubs such as West Coast, Adelaide and Brisbane have 30 odd years behind them, their premierships and years played statistics are of a meaningful sample size, remembering also that Hawthorn weren’t involved in the for three decades of league football.
After season 1994, West Coast had won two flags from just 8 seasons, giving them an impressive yet ultimately unsustainable average of a premiership every four years! You can see West Coast, Adelaide and also Brisbane race to the top of the table for a short time with the flags that they won, but with every season played since, a more realistic, yet still impressive story is told.

Which leads us to Fremantle. No premierships from 21 years competed. It seems rather harsh to see them down there as they’ve shown great competitiveness over the last decade, however when compared with other sides who have entered the competition in latter years, Gold Coast and West Sydney aside, it is unfortunately an accurate reflection. One could argue however, and probably successfully, that at both Fremantle’s and St.Kilda’s 21 year marks, the Dockers record is far stronger than that of the Saints. Ross Lyon’s coaching career appears to be solely focussed on addressing the bottom end of the premiership success table. How close he has come.

If you’ve made it this far then most likely you brain is swimming in a vortex of facts, figures and spreadsheets. I know mine is. Hawthorn have long been lauded as the most successful side of the modern game, but the numbers now stack up to place them at the top of the all time VFL-AFL table.
I know there are many who think that VFL and AFL premierships should be separated but as I see it, the league has always been continuous and fluid. Should they have started counting again when Hawthorn, North Melbourne and Footscray entered, the single largest injection of teams in any given year? I understand the argument but that’s why I believe that in counting the average years for premierships rather than the sheer amount gives us a more accurate reflection that rewards in particular the successes of Hawthorn, West Coast and Brisbane.
You can see each team’s historical success below, just click through the screens. If you’re keen for a copy of the excel spreadsheet then please contact me, I’m more than happy to share it.


Why not look at a measure of wins relative to league size? Winning a premiership in an 18 team comp is a lot harder than doing it in a 6 team comp. I think the Hawks would come out even better there.
Hey Hawks Fan…This is actually a great idea for one time down the track when I have the time to get stuck into it! Ta
Even though my head was spinning, I enjoyed your logic, and mathematical mind! There must be a footy publication somewhere that would love to print this .
Thanks Boot but as a Footscray diehard i won’t be requiring a spreadsheet; i can do the math….