
People just love to go to the footy, support their team, vent their spleen, and become one with the action on the field for a couple of hours a week, much like WEG’s depiction below. And attendances at AFL matches are at an all time high. Though the figure dipped slightly the past two years with new franchises the Suns and Giants, this was to be expected. Add to that the large sections of redevelopment occurring at the SCG and Kardinia Park, and the dip in attendances is merely a blip on the radar.
In the year 1980, with football yet to go national, the total attendance figure for VFL home and away matches was 3,280,129. From 2005 to 2012, it hasn’t been below 6 million, meaning in effect, league attendances have doubled with the introduction of the national competition. Case closed, Australian Football goes from strength to strength, and they all lived happily ever after. The end.
…Oh, you’re still reading? Well perhaps that’s not exactly right. There are a few questions now you mention it. Is the AFL (that’s the Australian Football League, not a reference to the sport; Australian Football) more popular than it’s ever been as the attendance figures suggest? Is the AFL an ever expanding juggernaut which will never stop? And just how accurate are these figures? Can they be bent to appear more impressive than they actually are?
Let’s look at some obvious differences between the years 1980 and 2012, and how they may have impacted the attendances.

-In 1980, games were played simultaneously on Saturday afternoon at two o’clock. If you wanted a second footy fix in 1980 then it was to the VFA on a Sunday! Come 2012 and it is rare to have any matches played at the same time, with Friday night, Saturday arvo, Saturday twilight, Saturday night, Sunday early, Sunday arvo and Sunday twilight filling each round. The point? You can attend 2, 3 or even 4 matches a week if you’re particularly keen.
-Round 1,1980. The previous years grand finalists, Collingwood and Carlton, were matched in a blockbuster fixture. However only 29,593 could cram into Victoria Park. The return match saw 43,903 shoehorned into Carlton, giving the fierce rivals an aggregate of attendance of 73,596 for the year. Fast-forward to 2012 and the two clubs boasted crowds of 84,259 and 75,890. The moral? In 1980, Collingwood, Carlton and Essendon played at suburban grounds, severely limiting their attendance figures. In 2012, more people can go. Simple. Crowd figures are becoming bendier!
Now we get serious…or silly, I’m not quite sure. There’s no doubting that footy now has a presence in rugby league strongholds NSW and Queensland that could only be dreamed of in 1980. Weekly footy, multiple premierships to Brisbane and Sydney with state of the art stadia. But what about the traditional footy states-Victoria, South Australia, Western Australia and Tasmania? Sure, attendances in the Apple Isle have risen 100% since 1980, but that’s yet another bendy stat.
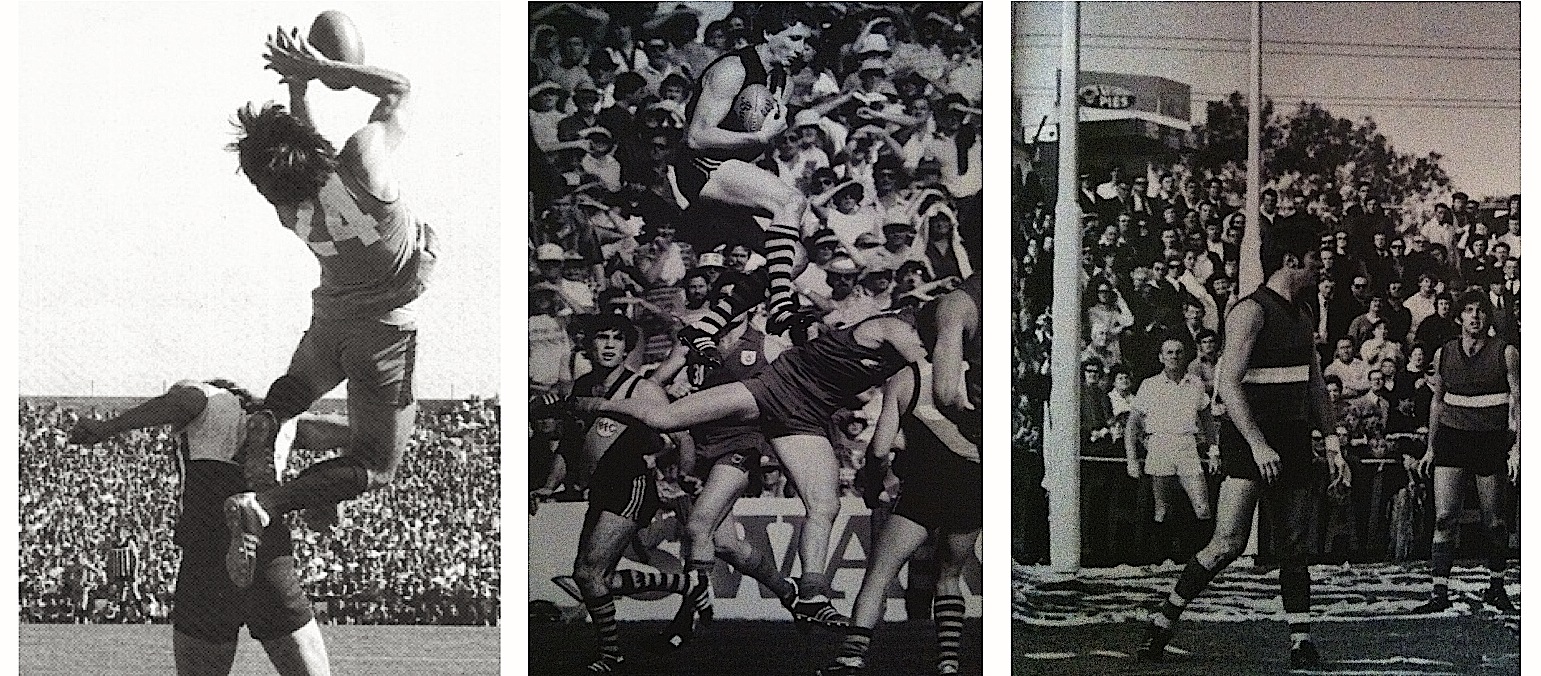
Top level footy in the SANFL, WAFL and VFL brought plenty of people through the gates! Left to right, Sturt’s Rick Davies, Claremont’s Warren Ralph, and Footscray fans, I might need your help with these two!
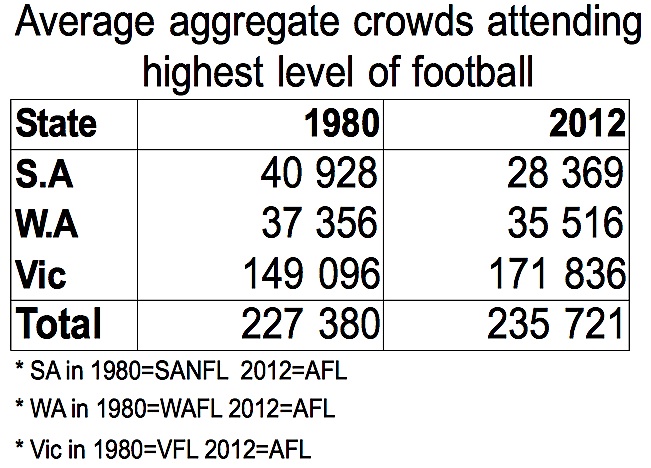
In 1980, the top level of footy you could watch in South Australia and Perth respectively were the SANFL and the WAFL. In Victoria of course it was the VFL, precursor to the AFL. The average attendance figure for a weekend of SANFL matches in 1980 was 40,928. The WAFL, 37, 356 and the VFL 149,096. Combined, the three states on average attracted 227,380 per week.
Fast forward to 2012, and South Australia’s average weekly AFL attendance is 28,369. In Western Australia it is 35,516. Only Victoria has seen an increase to the weekly attendance of top flight footy, now averaging 171,836 patrons.
Interestingly, the weekly average attendance in 1980 for the three states combined, 227,380, has risen only slightly in 2012 to 235,721 patrons weekly. The table below will hopefully shed some more light! Suffice to say, perhaps the current figures aren’t as healthy and as amazing as they seem.
But let’s take things up a notch and get a little crazy! In 1980, Perth’s population was 898,000. With 37,456 on average attending the WAFL weekly, this meant that 4.17% of Perth’s population was heading to the footy. Perth now has 1,832,114 people, meaning that with an average of 35,516 attending AFL matches weekly, just 1.93% of Perth residents attend top level footy weekly.
Adelaide’s population in 1980 was 943,000, meaning that 4.34% of Adeladians went to the footy of a weekend. With the population now sitting at 1,262,940, just 2.24% of Adelaide’s population attends the AFL weekly. Finally Victoria. 1980 population was 2,806,000, and 5.31% of the population would attend the top level footy on a weekend. In 2011 it sits at 4.12%, still a large number, yet still a lower percentage.
So the three strongest footy states in Australia combined saw 4.8% of their combined population going to the footy in 1980, and just 3.24 in 2012? Where’s the growth? What happened to the record attendances the AFL often beat their chests about?

For some longer term perspective, 1965, a momentous year for Australian Football, saw just 2,458,697 through the gates in Victoria for home and away matches. But with just 18 rounds played, it still saw 141,594 Melbournians attend the VFL weekly, and with the population sitting at 2,068,000, this meatn that nearly 7% of the population were at the footy on a Saturday! (6.84%).
Even further back to 1924, a year before the VFL’s expansion from 9 to 12 teams, and the VFL, with just 4 games a weekend, still averaged 81,974 patrons each round. The population of 800,000 meant that a whopping 10.24% of Melbournians attended the VFL weekly, a most remarkable figure. I’d go back further except that reliable records have not been kept prior to 1921.
Ok, so I’m going way over the top and am now bending stats to say just what I want, but that’s the point of this piece, to show that figures can be manipulated to say what you need them to say. The AFL themselves have said on numerous occasions that they fixture games to maximise attendances, and I’m not saying this is a bad thing (unless it compromises a fair fixture.) But it should be taken into consideration when we hear that the game is more popular than ever due to record attendances.
(The author does still acknowledge that AFL crowds are somewhat a phenomenon when compared world wide)
With a little help from my friends – Image of Rick Davies from bigfooty, while images of Claremont and Footscray games from ‘The Australian Game of Football-since 1858’
And as per usual, thanks to http://www.aflstats.tk for your comprehensive VFL/AFL stats!

Fascinating article John. One thing I’d take into consideration is that difference between matches where both teams are local, and matches where one is inter-state. In the former you can expect both sets of supporters to attend, which ups the average and aggregate. SA and WA AFL matches of that type only occur twice per year, and slightly less than half of all Victorian matches also come under this category.
That probably pushes the average down quite a lot, but also speaks to another under-appreciated issue: the more interstate teams there are, the fewer opportunities fans have to see their own local team. Fans are just not as well served as they used to be, when seeing every game your team played was probably feasible. [As an aside, earlier today I argued that the BBL was better than a pure state-based competition for precisely that reason].
Hey Russ, very good points your raise. There are many angles you could approach this topic, I guess the main idea was that it’s not as clear cut as it seems on the surface. Another point sould be that if Freo and WCE both played separate home games in the same round then you’d get close to 80,000 Perth attendees. It’d be interesting to do some further research into…we to me at least!
And yes, with byes, selling home games and the like, Richmond had a period last year where they played just one game in Melbourne over a 5 week period!
Great post John, crowd comparisons are a tricky one to untangle. There’s so many other factors that could be thrown into the mix, this is worthy of a feature in The Age – or perhaps a whole thesis! I’m thinking stuff like there being so many more sport & entertainment options available to the public now, a far greater multicultural demographic, population spread and difficulty to access CBD grounds, awkward fixturing times & all games now televised, cost of tickets v disposable income etc etc.
Very interesting article John. The only thing i can add is I think the Footscray player facing the camera is Gary Merrington!